Quantcast
Channel: Forex Forum - World Wide Invest
Viewing all 9027 articles
Browse latest View live

(Share) BinarySweetSpot

$
0
0
Hey guys!

Just want you to know that they have a sale at binarysweetspot dot com at the moment. Go and have a look. The sale ends today.

Binarysweetspot 4 is made by a BO-trader who couldn't find an indicator with all the elements he wanted to be included. It's really worth checking out. If you have any questions I can be of service.

(Req) Michael Gur Dillon – Traders Secret Success Package

(Req) Earnings Game Plan Low Risk High Return Option Plays (powercycletrading)

$
0
0
If anyone has this course please do share.

Here is what’s covered:
  • My 3 favorite neutral ~ non directional weekly option strategies for trading earnings
  • How to select the best neutral ~ non directional weekly option strategies based on the Implied Projected Move & Historical Statistics of the Stock
  • How & when to set-up all trade strategies
  • How to manage trades into option expiration
  • A little known, low cost, defined risk, premium collection strategy that is perfect for trading an earnings breakout.
  • Learn which strikes work best. Should you go far Out of the Money or Close in? You will find out.
  • How to take advantage of high option volatility for your earnings option plays
  • How to defend & manage an option trade gone wrong
  • The selection of the right stocks for earnings trades is very important to the success of an option strategy. You will learn how to use my 7 step selection process that makes building a watch list of great trading stocks easy to do
  • Step-by-step guide for using “Stock Pairs” for catching a pre or post earnings trend with reduced market risk
  • How to execute a Pairs Trend Trade using synthetic options
  • “Ninja” Ratio Option Butterfly for High-reward ~ Low-risk earnings release directional trades
  • Statistical resource for earnings history on all stocks
  • How to use this statistical information to analyze a stocks earnings release move or post earnings move for a Weekly Option or Pairs Trade Strategy


More Info
Link: Powercycletrading.com Earnings Game Plan - Low Risk High Return Option Plays
(note: a derefering service is used).

(Req) Bollinger Band of Freestockcharts on MT4

$
0
0
Hi guys, someone have BB indicator same of freestockharts as attached image

Thanks
Attached Images

(Share) FOREX: EURUSD & USDCHF – It’s Time to Make Money

$
0
0
eurusd_23-4-17.jpg

What is Next Move in EURUSD Index?

You must watch French Presidential Election and German Ifo Business Climate events today. It will play a big role in Euro currency price rate. These events can cause unexpected volatility!

IF YOU ARE MONEYMUNCH SUBSCRIBERS THEN DO NOT WORRY, WE PROVIDE YOU ALERT BY EMAIL & SMS.

Not promising: If we get time then I will update for you in FREE.

usdchf-23-4-17.jpg

USD/CHF has declined toward the support at 0.99433-0.99278-0.99147 levels before bouncing.
The Technical pattern is negative if USD/CHF below the resistance level 1.00252.
IF USD/CHF cross or close above the resistance level (0.99707), you will see above levels (0.99835 – 1.00079 – 1.00252).
Attached Images

(Req) Multicharts .NET 10 x86 and x64

$
0
0
Hello members:

Can someone share Multicharts .NET 10 x86 or x64 ?

I am currently trying to reverse engineer the Multicharts .NET x86 (I know debuggers and disassembly), if someone is well versed in reverse engineering please drop me a private message, I think I got it past the nag screen, but havent been able to properly figure out the server's Digital Rights Management, since it pings the server back and forth every 2 minutes or so with encrypted data.

If someone has an expired copy of Multicharts .NET 10 x86 and wants to try my nag fix, please private message me. I can share it with you for testing as long as you report me back the behavior in your expired Multhcarts.

Maxaman

(Share) USDJPY broke above channel resistance

$
0
0
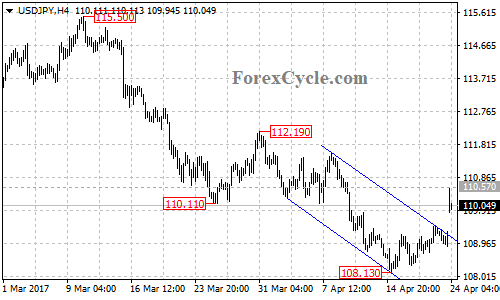
USDJPY broke above the top of the descending price channel on 4-hour chart, indicating that the downward movement from 112.19 had completed at 108.13 already. However, the bounce from 108.13 would possibly be consolidation of the longer term downtrend from 115.50. Range trading between 108.13 and 110.57 would likely be seen over the next several days. Resistance is at 110.57, only break above this level will confirm that the downtrend from 115.50 is complete, then the following upward movement could bring price to 113.00 zone.

USDJPY broke above channel resistance

(Req) Fapturbo 3 premium combo + fapturbo btc 2.4 premium ** req edu **


(Discuss) Dividend Aristocrats List for 2017

$
0
0
Over the long term, dividend investing is a great method of receiving a regular income, earning money back from the initial investment that was made. The biggest benefit of aristocrat stocks is that the dividend is growing on a consistent basis, which means that the capital is returned to shareholders quicker when compared to a steady dividend-paying stock over the same period.
An eligible company must be part of the S&P 500. In order to meet this requirement, the company must have a large enough market cap.
A dividend aristocrats list to look out for:
PepsiCo Inc.
Target Corporation
Procter & Gamble Co.
Kimberly Clark Corp.
3M Company

Any inputs?

(Share) 7900 indicators

(Share) XLpips accuracy over 90%

$
0
0
Buy the 'XLpips' Technical Indicator for MetaTrader 4 in MetaTrader Market

indicator show entry level, you can use tp or trilling stop


2017-04-24_144342.jpg

XLpips is an automated trading system based to the algorithm of neural networks. This indicator finds the most effective entry points and generates a signal in the form of arrows. Up arrow - buy, down arrow - sell. In addition, the indicator can predict the approach of price reversal and informs the trader by highlighting the histogram with a corresponding color and displaying a text message.

An additional advantage of this indicator is that it can send pushes and email notifications to a trader.

Indicator parameters:

parametr1 - indicator calculation parameter. It affects the wavelength of input analyzing number calculation. Through this parameter you set the frequency of signals.
bars - the number of bars used for the indicator calculation. The maximum value is 2000. The default value is 1000 (recommended).
UpColor - the color of the buy signal.
DownColor - the color of the sell signal.
FlatColor - the color of the flat signal.
TextColor - the color of the indicator text displayed on the chart.
email - email notification. Disabled by default.
push - push notification. Disabled by default.
alert - alert notifications. Disabled by default.
sound - a sound notification of a signal. Disabled by default.
music - the sound file to play. The sound file should be located in the 'Sounds' folder of your trading platform.
Important! This indicator does not redraw values.
Attached Images
Attached Files

(Share) USDJPY stays in a ascending price channel

$
0
0
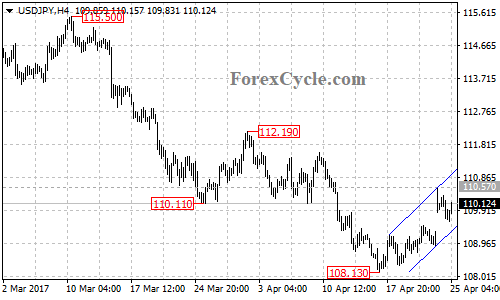
USDJPY stays in a ascending price channel on 4-hour chart and remains in short term uptrend from 108.13. As long as the pair is in the channel, the upward movement could be expected to continue, and next target would be at 112.00 area. On the downside, a clear break below the channel support will indicate that the upward movement had completed at 110.57 already, and the downtrend from 115.50 has resumed, then further decline to test 108.13 support could be seen.

USDJPY stays in a ascending price channel

(Share) Update : Eurusd & usdchf – it’s time to make money

$
0
0
tenor-1.gif

USDCHF HIT ALL TARGETS

What had I said about USDCHF INDEX before market open? open moneymunch for read full article.

I had said

“USD/CHF has declined toward the support at 0.99433-0.99278-0.99147 levels before bouncing.The Technical pattern is negative if USD/CHF below the resistance level 1.00252.
IF USD/CHF cross or close above the resistance level (0.99707), you will see above levels (0.99835 – 1.00079 – 1.00252).”
Attached Images

(Share) Daily Forex Analysis by ForexCycle

$
0
0
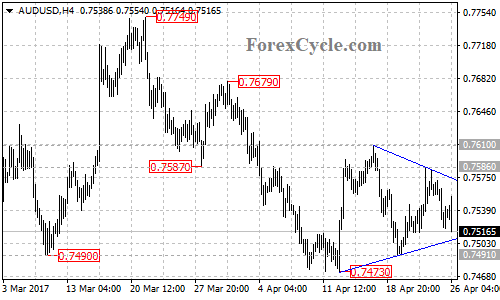
AUDUSD is forming a triangle pattern on 4-hour chart. Support is at 0.7491, a breakdown below this level will indicate that the downtrend from 0.7749 has resumed, then further following downward movement could bring price to 0.7400 area. Resistance is at 0.7586, a break of this level will confirm that the downtrend from 0.7749 had completed at 0.7473 already, then the following rebound could bring price to 0.7650 zone.

Daily Forex Analysis by ForexCycle

(Req) Blombo-Go EA


(ask) Broker with an Account with a minimal position size of 0.001 lots

$
0
0
I am looking for a broker with a minimal position size of 0.001 lot and that it isn´t a market maker.

(Share) Financial Market-FX Strategies

$
0
0
I just want to share these trading strategies according to their respective level: Courses | Trading Strategies

Level 1:
Trend Signal
Tunnel
Fractal

Level 2:
Fishing strip
Zigzag
Wave tracker

Level 3:
T-Chaser
Fibo Trap
Zoom in

(Discuss) Free Advisors MyfxPlay

$
0
0
Hey guys! Few weeks ago I've come across Free Forex Store | Best EA robots and trader signals in Forex market | MyfxPlay.com which provide free advisors. And I'm really impressed that it's not a scam. :eek:
I just wondering if anybody use it? And could you tell what trading style and risk are u using?

Now I trade with Forex inControl (EA Forex inControl Reborn - Download for free Forex Robot | MyfxPlay.com) and it's going good but i really concern about risks, so i need advice from the person who is trading with myfxplay for awhile!

(Req) Need an indicator that can copy object from any timeframe chat to offline chart in MT

$
0
0
I need an indicator, script or EA that can copy objects (like Trendline, horizontal line ) from any time frame to offline chart (eg H1 to H2) in mT4

Appreciate if someone can share it here.

(Req) Need candlestick pattern scanner

$
0
0
Hello,

looking for Pz candlestick pattern indicator

thanks
Viewing all 9027 articles
Browse latest View live